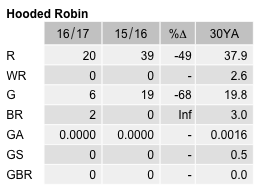
Hooded Robin
Melanodryas cucullata
ABR description
The following is extracted from the Annual Bird Report for the twelve months to June 2017.
Rare, breeding resident
Studies suggest a preference for Yellow-box/Blakely’s Red Gum grassy woodlands. Declared vulnerable in the ACT.
General: Number of birds seen (42) is half that of last year, with observations of between 1 – 4 birds. The reporting rate (0.1%) is the lowest it has ever been, 90% down on the 30YA. Sighted at only 7 locations mostly in open woodland, such as London Bridge (3 sightings), Brindabella Rd at East West Rd (11), and Googong Dam (3). Most records in winter 57%, with spring 5%, summer 33% and autumn 19%. 2 breeding records: dy/1 Jan Brindabella Rd East West Rd (SmA1) and cf/13 Jan at the same location (DaC3).
Abundance
Abundance is the average number of birds of that species per survey. Where the species was observed (presence recorded) but the number of birds seen was not recorded, this is treated as a count of zero.
Abundance by year
This chart shows the abundance of Hooded Robin between 1982 and 2017. 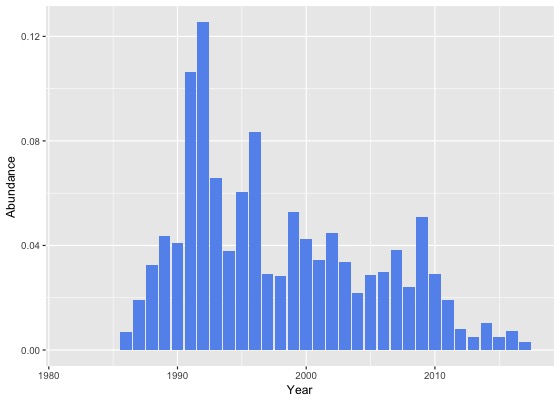
Abundance by month
This chart shows the monthly abundance of Hooded Robin. The blue lines show the abundance for the twelve months to June 2017 and the bars show the average abundance for the period 1982 to 2017. 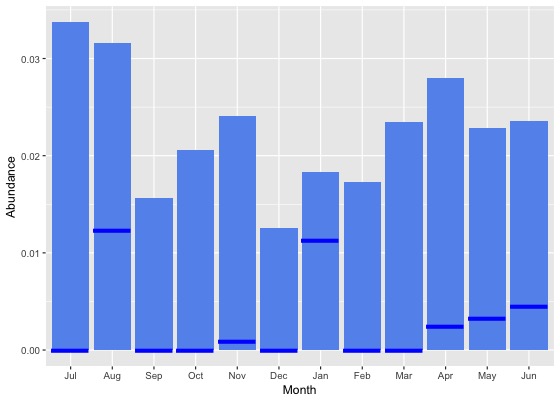
Abundance by season
This chart shows the seasonal abundance of Hooded Robin. The blue lines show the seasonal abundance for the twelve months to June 2017 and the bars show the average seasonal abundance for the period 1982 to 2017. 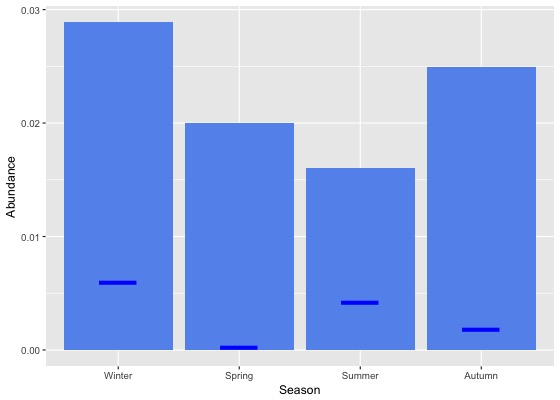
Abundance data
| Month | Season | ||||||||||||||||||
|---|---|---|---|---|---|---|---|---|---|---|---|---|---|---|---|---|---|---|---|
| Period | Jul | Aug | Sep | Oct | Nov | Dec | Jan | Feb | Mar | Apr | May | Jun | Winter | Spring | Summer | Autumn | All | ||
| All years | |||||||||||||||||||
| All | 0.0 | 0.0 | 0.0 | 0.0 | 0.0 | 0.0 | 0.0 | 0.0 | 0.0 | 0.0 | 0.0 | 0.0 | 0.0 | 0.0 | 0.0 | 0.0 | 0.0 | ||
| Previous years | |||||||||||||||||||
| All previous years | 0.0 | 0.0 | 0.0 | 0.0 | 0.0 | 0.0 | 0.0 | 0.0 | 0.0 | 0.0 | 0.0 | 0.0 | 0.0 | 0.0 | 0.0 | 0.0 | 0.0 | ||
| Previous 30 years | 0.0 | 0.0 | 0.0 | 0.0 | 0.0 | 0.0 | 0.0 | 0.0 | 0.0 | 0.0 | 0.0 | 0.0 | 0.0 | 0.0 | 0.0 | 0.0 | 0.0 | ||
| Previous 20 years | 0.0 | 0.0 | 0.0 | 0.0 | 0.0 | 0.0 | 0.0 | 0.0 | 0.0 | 0.0 | 0.0 | 0.0 | 0.0 | 0.0 | 0.0 | 0.0 | 0.0 | ||
| 10 year groups | |||||||||||||||||||
| [2007,2017) | 0.0 | 0.0 | 0.0 | 0.0 | 0.0 | 0.0 | 0.0 | 0.0 | 0.0 | 0.0 | 0.0 | 0.0 | 0.0 | 0.0 | 0.0 | 0.0 | 0.0 | ||
| [1997,2007) | 0.0 | 0.0 | 0.0 | 0.0 | 0.1 | 0.0 | 0.0 | 0.0 | 0.0 | 0.0 | 0.0 | 0.0 | 0.0 | 0.0 | 0.0 | 0.0 | 0.0 | ||
| [1987,1997) | 0.1 | 0.1 | 0.0 | 0.0 | 0.0 | 0.0 | 0.0 | 0.0 | 0.1 | 0.1 | 0.1 | 0.1 | 0.1 | 0.0 | 0.0 | 0.1 | 0.1 | ||
| 5 year groups | |||||||||||||||||||
| [2012,2017) | 0.0 | 0.0 | 0.0 | 0.0 | 0.0 | 0.0 | 0.0 | 0.0 | 0.0 | 0.0 | 0.0 | 0.0 | 0.0 | 0.0 | 0.0 | 0.0 | 0.0 | ||
| [2007,2012) | 0.1 | 0.0 | 0.0 | 0.0 | 0.0 | 0.0 | 0.0 | 0.0 | 0.0 | 0.1 | 0.0 | 0.0 | 0.0 | 0.0 | 0.0 | 0.0 | 0.0 | ||
| [2002,2007) | 0.0 | 0.0 | 0.0 | 0.0 | 0.0 | 0.0 | 0.0 | 0.0 | 0.0 | 0.0 | 0.0 | 0.0 | 0.0 | 0.0 | 0.0 | 0.0 | 0.0 | ||
| [1997,2002) | 0.1 | 0.0 | 0.0 | 0.0 | 0.1 | 0.0 | 0.0 | 0.0 | 0.0 | 0.0 | 0.1 | 0.0 | 0.0 | 0.0 | 0.0 | 0.0 | 0.0 | ||
| [1992,1997) | 0.1 | 0.1 | 0.1 | 0.1 | 0.1 | 0.0 | 0.1 | 0.1 | 0.1 | 0.1 | 0.0 | 0.0 | 0.1 | 0.1 | 0.1 | 0.1 | 0.1 | ||
| [1987,1992) | 0.1 | 0.0 | 0.0 | 0.0 | 0.0 | 0.0 | 0.0 | 0.0 | 0.0 | 0.1 | 0.1 | 0.1 | 0.1 | 0.0 | 0.0 | 0.1 | 0.0 | ||
| Year | |||||||||||||||||||
| 2017 | 0.0 | 0.0 | 0.0 | 0.0 | 0.0 | 0.0 | 0.0 | 0.0 | 0.0 | 0.0 | 0.0 | 0.0 | 0.0 | 0.0 | 0.0 | 0.0 | 0.0 | ||
| 2016 | 0.0 | 0.0 | 0.0 | 0.0 | 0.0 | 0.0 | 0.0 | 0.0 | 0.0 | 0.0 | 0.0 | 0.0 | 0.0 | 0.0 | 0.0 | 0.0 | 0.0 | ||
| 2015 | 0.0 | 0.0 | 0.0 | 0.0 | 0.0 | 0.0 | 0.0 | 0.0 | 0.0 | 0.0 | 0.0 | 0.0 | 0.0 | 0.0 | 0.0 | 0.0 | 0.0 | ||
| 2014 | 0.0 | 0.0 | 0.0 | 0.0 | 0.0 | 0.0 | 0.0 | 0.0 | 0.0 | 0.0 | 0.0 | 0.0 | 0.0 | 0.0 | 0.0 | 0.0 | 0.0 | ||
| 2013 | 0.0 | 0.0 | 0.0 | 0.0 | 0.0 | 0.0 | 0.0 | 0.0 | 0.0 | 0.0 | 0.0 | 0.0 | 0.0 | 0.0 | 0.0 | 0.0 | 0.0 | ||
| 2012 | 0.0 | 0.0 | 0.0 | 0.0 | 0.0 | 0.0 | 0.0 | 0.0 | 0.0 | 0.0 | 0.0 | 0.0 | 0.0 | 0.0 | 0.0 | 0.0 | 0.0 | ||
| 2011 | 0.0 | 0.0 | 0.0 | 0.0 | 0.0 | 0.0 | 0.0 | 0.0 | 0.0 | 0.1 | 0.0 | 0.0 | 0.0 | 0.0 | 0.0 | 0.0 | 0.0 | ||
| 2010 | 0.0 | 0.0 | 0.0 | 0.0 | 0.0 | 0.0 | 0.1 | 0.1 | 0.1 | 0.1 | 0.0 | 0.0 | 0.0 | 0.0 | 0.0 | 0.1 | 0.0 | ||
| 2009 | 0.1 | 0.1 | 0.0 | 0.0 | 0.0 | 0.0 | 0.0 | 0.1 | 0.1 | 0.1 | 0.0 | 0.0 | 0.1 | 0.0 | 0.0 | 0.1 | 0.1 | ||
| 2008 | 0.1 | 0.0 | 0.0 | 0.0 | 0.0 | 0.0 | 0.0 | 0.0 | 0.0 | 0.0 | 0.1 | 0.0 | 0.0 | 0.0 | 0.0 | 0.0 | 0.0 | ||
| 2007 | 0.0 | 0.0 | 0.0 | 0.0 | 0.1 | 0.0 | 0.1 | 0.1 | 0.1 | 0.0 | 0.1 | 0.0 | 0.0 | 0.0 | 0.0 | 0.0 | 0.0 | ||
| 2006 | 0.1 | 0.1 | 0.0 | 0.0 | 0.1 | 0.0 | 0.0 | 0.0 | 0.0 | 0.0 | 0.0 | 0.0 | 0.1 | 0.0 | 0.0 | 0.0 | 0.0 | ||
| 2005 | 0.0 | 0.0 | 0.0 | 0.0 | 0.0 | 0.1 | 0.0 | 0.0 | 0.0 | 0.0 | 0.0 | 0.1 | 0.0 | 0.0 | 0.0 | 0.0 | 0.0 | ||
| 2004 | 0.0 | 0.0 | 0.0 | 0.0 | 0.0 | 0.0 | 0.0 | 0.1 | 0.0 | 0.0 | 0.0 | 0.0 | 0.0 | 0.0 | 0.0 | 0.0 | 0.0 | ||
| 2003 | 0.0 | 0.0 | 0.0 | 0.0 | 0.1 | 0.0 | 0.0 | 0.0 | 0.0 | 0.1 | 0.1 | 0.0 | 0.0 | 0.0 | 0.0 | 0.0 | 0.0 | ||
| 2002 | 0.1 | 0.1 | 0.0 | 0.0 | 0.0 | 0.0 | 0.1 | 0.1 | 0.1 | 0.0 | 0.1 | 0.1 | 0.1 | 0.0 | 0.0 | 0.0 | 0.0 | ||
| 2001 | 0.1 | 0.0 | 0.0 | 0.1 | 0.0 | 0.0 | 0.0 | 0.1 | 0.0 | 0.0 | 0.1 | 0.0 | 0.0 | 0.0 | 0.0 | 0.0 | 0.0 | ||
| 2000 | 0.1 | 0.0 | 0.0 | 0.0 | 0.1 | 0.0 | 0.0 | 0.0 | 0.0 | 0.1 | 0.0 | 0.1 | 0.1 | 0.1 | 0.0 | 0.0 | 0.0 | ||
| 1999 | 0.1 | 0.0 | 0.0 | 0.0 | 0.1 | 0.1 | 0.0 | 0.0 | 0.1 | 0.0 | 0.1 | 0.0 | 0.0 | 0.0 | 0.1 | 0.1 | 0.1 | ||
| 1998 | 0.0 | 0.0 | 0.0 | 0.0 | 0.0 | 0.0 | 0.2 | 0.1 | 0.0 | 0.0 | 0.0 | 0.0 | 0.0 | 0.0 | 0.1 | 0.0 | 0.0 | ||
| 1997 | 0.0 | 0.0 | 0.0 | 0.0 | 0.1 | 0.0 | 0.1 | 0.0 | 0.1 | 0.0 | 0.0 | 0.0 | 0.0 | 0.0 | 0.0 | 0.0 | 0.0 | ||
| 1996 | 0.1 | 0.2 | 0.1 | 0.1 | 0.1 | 0.1 | 0.1 | 0.0 | 0.0 | 0.0 | 0.1 | 0.0 | 0.1 | 0.1 | 0.1 | 0.1 | 0.1 | ||
| 1995 | 0.2 | 0.0 | 0.0 | 0.0 | 0.0 | 0.0 | 0.1 | 0.1 | 0.1 | 0.1 | 0.1 | 0.1 | 0.1 | 0.0 | 0.1 | 0.1 | 0.1 | ||
| 1994 | 0.1 | 0.1 | 0.1 | 0.0 | 0.0 | 0.1 | 0.0 | 0.0 | 0.1 | 0.0 | 0.0 | 0.0 | 0.0 | 0.0 | 0.0 | 0.0 | 0.0 | ||
| 1993 | 0.1 | 0.1 | 0.1 | 0.1 | 0.0 | 0.0 | 0.0 | 0.0 | 0.1 | 0.1 | 0.0 | 0.1 | 0.1 | 0.1 | 0.0 | 0.1 | 0.1 | ||
| 1992 | 0.3 | 0.2 | 0.2 | 0.1 | 0.2 | 0.1 | 0.0 | 0.1 | 0.2 | 0.1 | 0.0 | 0.0 | 0.2 | 0.2 | 0.1 | 0.1 | 0.1 | ||
| 1991 | 0.1 | 0.1 | 0.1 | 0.0 | 0.2 | 0.0 | 0.0 | 0.1 | 0.1 | 0.2 | 0.1 | 0.2 | 0.1 | 0.1 | 0.0 | 0.1 | 0.1 | ||
| 1990 | 0.1 | 0.0 | 0.0 | 0.0 | 0.0 | 0.0 | 0.1 | 0.0 | 0.0 | 0.1 | 0.2 | 0.1 | 0.0 | 0.0 | 0.0 | 0.1 | 0.0 | ||
| 1989 | 0.0 | 0.1 | 0.0 | 0.0 | 0.0 | 0.0 | 0.0 | 0.0 | 0.0 | 0.1 | 0.0 | 0.1 | 0.1 | 0.0 | 0.0 | 0.0 | 0.0 | ||
| 1988 | 0.0 | 0.0 | 0.0 | 0.0 | 0.0 | 0.0 | 0.0 | 0.0 | 0.0 | 0.0 | 0.0 | 0.0 | 0.0 | 0.0 | 0.0 | 0.0 | 0.0 | ||
| 1987 | 0.0 | 0.0 | 0.0 | 0.0 | 0.0 | 0.0 | 0.0 | 0.0 | 0.0 | 0.0 | 0.0 | 0.0 | 0.0 | 0.0 | 0.0 | 0.0 | 0.0 | ||
| 1986 | 0.0 | 0.0 | 0.0 | 0.0 | 0.0 | 0.0 | 0.0 | 0.0 | 0.0 | 0.0 | 0.0 | 0.0 | 0.0 | 0.0 | 0.0 | 0.0 | 0.0 | ||
| 1985 | 0.0 | 0.0 | 0.0 | 0.0 | 0.0 | 0.0 | 0.0 | 0.0 | 0.0 | 0.0 | 0.0 | 0.0 | 0.0 | 0.0 | 0.0 | 0.0 | 0.0 | ||
| 1984 | 0.0 | 0.0 | 0.0 | 0.0 | 0.0 | 0.0 | 0.0 | 0.0 | 0.0 | 0.0 | 0.0 | 0.0 | 0.0 | 0.0 | 0.0 | 0.0 | 0.0 | ||
| 1983 | 0.0 | 0.0 | 0.0 | 0.0 | 0.0 | 0.0 | 0.0 | 0.0 | 0.0 | - | 0.0 | 0.0 | 0.0 | 0.0 | 0.0 | 0.0 | 0.0 | ||
| 1982 | - | 0.0 | - | 0.0 | 0.0 | 0.0 | - | 0.0 | - | 0.0 | - | 0.0 | 0.0 | 0.0 | 0.0 | 0.0 | 0.0 | ||
Reporting rates
Reporting rate is the proportion of all surveys in which the species was present.
Reporting rate by year
This chart shows the reporting rate of Hooded Robin each year between 1982 and 2017. 
Reporting rate by month
This chart shows the reporting rate by month of Hooded Robin. The blue lines show the reporting rate for the twelve months to June 2017 and the bars show the average reporting rate for the period 1982 to 2017. 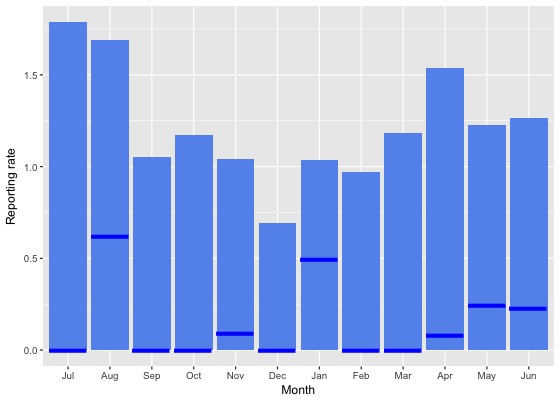
Reporting rate by season
This chart shows the seasonal reporting rate of Hooded Robin. The blue lines show the seasonal reporting rate for the twelve months to June 2017 and the bars show the average seasonal reporting rate for the period 1982 to 2017. 
Reporting rate data
| Month | Season | ||||||||||||||||||
|---|---|---|---|---|---|---|---|---|---|---|---|---|---|---|---|---|---|---|---|
| Period | Jul | Aug | Sep | Oct | Nov | Dec | Jan | Feb | Mar | Apr | May | Jun | Winter | Spring | Summer | Autumn | All | ||
| All years | |||||||||||||||||||
| All | 1.8 | 1.7 | 1.1 | 1.2 | 1.0 | 0.7 | 1.0 | 1.0 | 1.2 | 1.5 | 1.2 | 1.3 | 1.5 | 1.1 | 0.9 | 1.3 | 1.2 | ||
| Previous years | |||||||||||||||||||
| All previous years | 2.1 | 1.9 | 1.2 | 1.3 | 1.2 | 0.8 | 1.1 | 1.2 | 1.4 | 1.8 | 1.5 | 1.5 | 1.8 | 1.3 | 1.0 | 1.5 | 1.4 | ||
| Previous 30 years | 2.1 | 1.9 | 1.2 | 1.3 | 1.2 | 0.8 | 1.1 | 1.2 | 1.4 | 1.8 | 1.5 | 1.5 | 1.8 | 1.3 | 1.0 | 1.6 | 1.4 | ||
| Previous 20 years | 1.3 | 1.2 | 0.9 | 1.1 | 0.9 | 0.7 | 0.8 | 0.8 | 1.0 | 1.4 | 0.9 | 1.0 | 1.2 | 1.0 | 0.8 | 1.1 | 1.0 | ||
| 10 year groups | |||||||||||||||||||
| [2007,2017) | 0.8 | 1.1 | 0.5 | 1.0 | 0.4 | 0.4 | 0.6 | 0.6 | 0.6 | 1.4 | 0.5 | 0.5 | 0.7 | 0.7 | 0.5 | 0.9 | 0.7 | ||
| [1997,2007) | 2.2 | 1.6 | 1.5 | 1.6 | 1.9 | 1.2 | 1.4 | 1.6 | 1.8 | 1.6 | 1.8 | 2.1 | 2.0 | 1.7 | 1.4 | 1.7 | 1.7 | ||
| [1987,1997) | 4.8 | 4.0 | 2.9 | 2.8 | 2.2 | 1.6 | 3.4 | 2.9 | 3.9 | 3.7 | 3.6 | 4.0 | 4.2 | 2.6 | 2.6 | 3.7 | 3.3 | ||
| 5 year groups | |||||||||||||||||||
| [2012,2017) | 0.4 | 0.9 | 0.4 | 0.6 | 0.1 | 0.2 | 0.3 | 0.3 | 0.2 | 0.8 | 0.3 | 0.1 | 0.4 | 0.4 | 0.3 | 0.5 | 0.4 | ||
| [2007,2012) | 2.0 | 2.0 | 0.9 | 1.6 | 1.5 | 0.8 | 1.6 | 1.7 | 1.7 | 2.6 | 1.1 | 1.1 | 1.5 | 1.4 | 1.2 | 1.9 | 1.5 | ||
| [2002,2007) | 1.8 | 1.6 | 1.1 | 1.2 | 1.9 | 1.4 | 1.3 | 1.5 | 1.7 | 1.3 | 1.4 | 1.9 | 1.8 | 1.4 | 1.4 | 1.5 | 1.5 | ||
| [1997,2002) | 2.9 | 1.5 | 2.0 | 2.1 | 1.9 | 1.0 | 1.6 | 1.7 | 1.9 | 1.9 | 2.3 | 2.4 | 2.3 | 2.0 | 1.3 | 2.0 | 1.9 | ||
| [1992,1997) | 5.8 | 3.7 | 5.1 | 2.6 | 3.0 | 2.6 | 2.3 | 3.2 | 4.8 | 3.0 | 2.7 | 1.5 | 3.5 | 3.5 | 2.7 | 3.5 | 3.3 | ||
| [1987,1992) | 4.3 | 4.2 | 1.9 | 2.9 | 1.8 | 1.2 | 3.9 | 2.7 | 3.4 | 4.2 | 4.1 | 5.4 | 4.6 | 2.2 | 2.6 | 3.9 | 3.2 | ||
| Year | |||||||||||||||||||
| 2017 | 0.0 | 0.6 | 0.0 | 0.0 | 0.1 | 0.0 | 0.5 | 0.0 | 0.0 | 0.1 | 0.2 | 0.2 | 0.3 | 0.0 | 0.2 | 0.1 | 0.1 | ||
| 2016 | 0.6 | 2.0 | 0.3 | 0.2 | 0.1 | 0.0 | 0.0 | 0.1 | 0.4 | 0.3 | 0.2 | 0.1 | 1.0 | 0.2 | 0.0 | 0.3 | 0.3 | ||
| 2015 | 0.0 | 0.2 | 0.1 | 0.5 | 0.2 | 0.7 | 0.2 | 0.0 | 0.0 | 0.9 | 0.0 | 0.1 | 0.1 | 0.3 | 0.3 | 0.3 | 0.3 | ||
| 2014 | 0.6 | 0.0 | 0.3 | 0.6 | 0.0 | 0.0 | 0.9 | 1.2 | 0.2 | 1.5 | 0.7 | 0.0 | 0.1 | 0.4 | 0.8 | 0.8 | 0.6 | ||
| 2013 | 0.5 | 0.0 | 0.2 | 0.2 | 0.0 | 0.0 | 0.4 | 0.6 | 0.2 | 1.4 | 1.3 | 0.4 | 0.3 | 0.1 | 0.3 | 0.9 | 0.4 | ||
| 2012 | 0.0 | 0.0 | 1.2 | 1.7 | 0.0 | 0.3 | 0.2 | 0.0 | 0.0 | 0.8 | 0.0 | 0.0 | 0.0 | 1.2 | 0.2 | 0.3 | 0.5 | ||
| 2011 | 0.0 | 1.6 | 0.8 | 1.0 | 0.6 | 0.0 | 0.9 | 0.5 | 0.0 | 4.4 | 0.0 | 1.5 | 1.2 | 0.9 | 0.4 | 1.5 | 1.0 | ||
| 2010 | 1.0 | 0.9 | 0.7 | 1.1 | 1.0 | 0.0 | 2.9 | 2.4 | 1.6 | 3.4 | 2.0 | 1.1 | 1.1 | 0.9 | 1.4 | 2.4 | 1.4 | ||
| 2009 | 5.0 | 5.2 | 2.3 | 1.8 | 2.7 | 1.1 | 1.3 | 3.3 | 3.7 | 2.9 | 0.8 | 1.4 | 3.3 | 2.1 | 1.7 | 2.7 | 2.4 | ||
| 2008 | 2.1 | 0.9 | 0.4 | 2.1 | 0.0 | 1.4 | 0.0 | 0.9 | 1.6 | 0.6 | 1.8 | 0.9 | 1.3 | 1.3 | 0.9 | 1.1 | 1.2 | ||
| 2007 | 1.1 | 1.9 | 0.4 | 2.0 | 2.7 | 1.7 | 2.4 | 2.6 | 2.1 | 1.7 | 2.4 | 0.7 | 1.0 | 1.7 | 2.1 | 2.0 | 1.7 | ||
| 2006 | 2.6 | 2.9 | 0.4 | 0.8 | 2.4 | 0.6 | 1.7 | 0.7 | 0.9 | 2.2 | 0.0 | 1.9 | 2.3 | 1.0 | 1.0 | 1.1 | 1.3 | ||
| 2005 | 1.5 | 0.9 | 0.7 | 0.6 | 2.1 | 2.8 | 2.1 | 0.0 | 0.0 | 0.5 | 1.0 | 2.7 | 2.0 | 1.0 | 2.1 | 0.5 | 1.3 | ||
| 2004 | 1.2 | 0.7 | 1.4 | 0.6 | 1.7 | 0.9 | 0.6 | 3.0 | 2.6 | 1.1 | 0.0 | 0.0 | 0.7 | 1.3 | 1.2 | 1.5 | 1.2 | ||
| 2003 | 0.9 | 0.7 | 1.3 | 1.6 | 2.8 | 1.3 | 0.0 | 0.5 | 1.8 | 2.3 | 3.1 | 1.9 | 1.2 | 1.9 | 0.7 | 2.3 | 1.6 | ||
| 2002 | 2.9 | 3.4 | 2.0 | 2.6 | 0.5 | 1.2 | 1.9 | 3.3 | 3.6 | 0.0 | 3.5 | 2.7 | 2.9 | 1.7 | 1.8 | 2.3 | 2.1 | ||
| 2001 | 3.1 | 1.8 | 2.7 | 3.4 | 0.6 | 1.1 | 0.0 | 2.6 | 1.5 | 0.5 | 2.9 | 2.5 | 2.5 | 2.4 | 1.2 | 1.5 | 1.9 | ||
| 2000 | 3.2 | 2.0 | 1.9 | 1.3 | 2.3 | 0.3 | 1.2 | 0.5 | 1.6 | 3.5 | 0.9 | 4.3 | 3.2 | 1.8 | 0.7 | 2.2 | 1.8 | ||
| 1999 | 8.8 | 2.1 | 2.3 | 1.9 | 3.2 | 2.5 | 1.5 | 1.4 | 3.2 | 3.1 | 3.4 | 1.4 | 2.3 | 2.5 | 1.8 | 3.2 | 2.5 | ||
| 1998 | 2.7 | 0.0 | 0.8 | 1.1 | 0.9 | 0.9 | 4.4 | 1.9 | 0.0 | 0.0 | 0.0 | 2.7 | 1.8 | 0.9 | 2.2 | 0.0 | 1.3 | ||
| 1997 | 0.0 | 0.0 | 0.9 | 2.6 | 2.6 | 0.0 | 5.9 | 3.5 | 5.0 | 0.0 | 0.0 | 0.0 | 0.0 | 2.0 | 2.4 | 1.0 | 1.4 | ||
| 1996 | 4.5 | 6.4 | 4.0 | 5.3 | 4.6 | 4.0 | 3.9 | 3.5 | 2.9 | 1.6 | 6.9 | 0.0 | 3.6 | 4.7 | 3.8 | 3.6 | 4.0 | ||
| 1995 | 5.4 | 0.0 | 2.9 | 1.2 | 0.0 | 0.0 | 3.5 | 6.3 | 4.1 | 4.0 | 5.2 | 2.1 | 2.2 | 1.3 | 3.0 | 4.3 | 2.6 | ||
| 1994 | 3.9 | 3.9 | 2.9 | 0.0 | 2.9 | 4.3 | 1.5 | 0.0 | 4.5 | 0.8 | 0.0 | 0.0 | 2.3 | 2.1 | 1.7 | 1.7 | 1.9 | ||
| 1993 | 4.1 | 3.8 | 4.8 | 2.7 | 1.5 | 0.0 | 0.0 | 0.0 | 4.9 | 8.3 | 2.6 | 5.8 | 4.6 | 3.0 | 0.0 | 5.0 | 3.5 | ||
| 1992 | 10.8 | 7.4 | 10.6 | 4.3 | 6.9 | 4.8 | 0.0 | 4.9 | 8.5 | 1.7 | 0.0 | 0.0 | 6.1 | 7.2 | 3.1 | 3.4 | 5.1 | ||
| 1991 | 5.5 | 3.2 | 2.3 | 2.9 | 4.1 | 0.0 | 1.8 | 2.0 | 4.8 | 8.5 | 4.9 | 8.0 | 5.2 | 3.1 | 1.1 | 6.0 | 3.9 | ||
| 1990 | 5.8 | 3.2 | 1.1 | 3.1 | 0.0 | 0.0 | 5.6 | 0.0 | 2.3 | 3.6 | 5.5 | 3.9 | 4.3 | 1.3 | 1.9 | 3.7 | 3.0 | ||
| 1989 | 4.6 | 5.2 | 3.1 | 5.0 | 2.5 | 3.5 | 4.8 | 3.6 | 2.2 | 5.6 | 4.6 | 8.3 | 5.9 | 3.6 | 3.9 | 4.2 | 4.4 | ||
| 1988 | 2.6 | 4.5 | 1.7 | 2.3 | 2.8 | 0.5 | 4.5 | 4.0 | 4.0 | 4.3 | 3.0 | 4.8 | 4.0 | 2.4 | 3.0 | 3.7 | 3.2 | ||
| 1987 | 0.0 | 0.0 | 1.2 | 1.2 | 0.3 | 0.0 | 2.6 | 2.1 | 3.8 | 2.1 | 3.9 | 3.4 | 3.0 | 0.8 | 1.5 | 3.2 | 1.9 | ||
| 1986 | 0.0 | 0.0 | 1.9 | 0.0 | 0.0 | 0.0 | 0.0 | 0.0 | 0.0 | 0.0 | 3.4 | 0.0 | 0.0 | 0.7 | 0.0 | 0.9 | 0.5 | ||
| 1985 | 0.0 | 0.0 | 0.0 | 0.0 | 0.0 | 0.0 | 0.0 | 0.0 | 0.0 | 0.0 | 0.0 | 0.0 | 0.0 | 0.0 | 0.0 | 0.0 | 0.0 | ||
| 1984 | 0.0 | 0.0 | 0.0 | 0.0 | 0.0 | 0.0 | 0.0 | 0.0 | 0.0 | 0.0 | 0.0 | 0.0 | 0.0 | 0.0 | 0.0 | 0.0 | 0.0 | ||
| 1983 | 0.0 | 0.0 | 0.0 | 0.0 | 0.0 | 0.0 | 0.0 | 0.0 | 0.0 | - | 0.0 | 0.0 | 0.0 | 0.0 | 0.0 | 0.0 | 0.0 | ||
| 1982 | - | 0.0 | - | 0.0 | 0.0 | 0.0 | - | 0.0 | - | 0.0 | - | 0.0 | 0.0 | 0.0 | 0.0 | 0.0 | 0.0 | ||
Breeding data
Breeding records by month
Number of breeding records by breeding code and month, 2017 and all years| Breeding code | Jul | Aug | Sep | Oct | Nov | Dec | Jan | Feb | Mar | Apr | May | Jun |
|---|---|---|---|---|---|---|---|---|---|---|---|---|
| 2017 | ||||||||||||
| Breeding (BLA code) | 0 | 0 | 0 | 0 | 0 | 0 | 0 | 0 | 0 | 0 | 0 | 0 |
| Carrying Food | 0 | 0 | 0 | 0 | 0 | 0 | 1 | 0 | 0 | 0 | 0 | 0 |
| Copulating | 0 | 0 | 0 | 0 | 0 | 0 | 0 | 0 | 0 | 0 | 0 | 0 |
| Display | 0 | 0 | 0 | 0 | 0 | 0 | 0 | 0 | 0 | 0 | 0 | 0 |
| Dependent young | 0 | 0 | 0 | 0 | 0 | 0 | 1 | 0 | 0 | 0 | 0 | 0 |
| Faecal sac | 0 | 0 | 0 | 0 | 0 | 0 | 0 | 0 | 0 | 0 | 0 | 0 |
| Inspecting hollow | 0 | 0 | 0 | 0 | 0 | 0 | 0 | 0 | 0 | 0 | 0 | 0 |
| Nest building | 0 | 0 | 0 | 0 | 0 | 0 | 0 | 0 | 0 | 0 | 0 | 0 |
| Nest with eggs | 0 | 0 | 0 | 0 | 0 | 0 | 0 | 0 | 0 | 0 | 0 | 0 |
| Nest with young | 0 | 0 | 0 | 0 | 0 | 0 | 0 | 0 | 0 | 0 | 0 | 0 |
| On/leaving nest | 0 | 0 | 0 | 0 | 0 | 0 | 0 | 0 | 0 | 0 | 0 | 0 |
| All years | ||||||||||||
| Breeding (BLA code) | 0 | 0 | 0 | 1 | 1 | 0 | 2 | 0 | 1 | 0 | 0 | 0 |
| Carrying Food | 0 | 0 | 1 | 3 | 3 | 0 | 1 | 0 | 0 | 0 | 0 | 0 |
| Copulating | 0 | 1 | 0 | 0 | 0 | 0 | 0 | 0 | 0 | 0 | 0 | 0 |
| Display | 0 | 0 | 2 | 0 | 0 | 0 | 0 | 0 | 0 | 0 | 0 | 0 |
| Dependent young | 0 | 0 | 1 | 15 | 12 | 4 | 14 | 9 | 6 | 1 | 1 | 0 |
| Faecal sac | 0 | 0 | 0 | 0 | 0 | 0 | 0 | 0 | 0 | 0 | 0 | 0 |
| Inspecting hollow | 0 | 0 | 0 | 0 | 0 | 0 | 0 | 0 | 0 | 0 | 0 | 0 |
| Nest building | 0 | 0 | 1 | 0 | 1 | 1 | 0 | 0 | 0 | 0 | 0 | 0 |
| Nest with eggs | 0 | 1 | 1 | 0 | 1 | 1 | 0 | 0 | 0 | 0 | 0 | 0 |
| Nest with young | 0 | 0 | 0 | 3 | 0 | 1 | 0 | 0 | 0 | 0 | 0 | 0 |
| On/leaving nest | 0 | 0 | 2 | 1 | 0 | 0 | 0 | 0 | 0 | 0 | 0 | 0 |
Breeding records by year
Average number of breeding records per period by breeding code| Period | Breeding (BLA code) | Carrying Food | Copulating | Display | Dependent young | Faecal sac | Inspecting hollow | Nest building | Nest with eggs | Nest with young | On/leaving nest |
|---|---|---|---|---|---|---|---|---|---|---|---|
| All years | |||||||||||
| All | 0.1 | 0.2 | 0.0 | 0.1 | 1.8 | 0.0 | 0.0 | 0.1 | 0.1 | 0.1 | 0.1 |
| Previous years | |||||||||||
| All previous years | 0.1 | 0.2 | 0.0 | 0.1 | 1.8 | 0.0 | 0.0 | 0.1 | 0.1 | 0.1 | 0.1 |
| Previous 30 years | 0.2 | 0.2 | 0.0 | 0.1 | 2.1 | 0.0 | 0.0 | 0.1 | 0.1 | 0.1 | 0.1 |
| Previous 20 years | 0.2 | 0.2 | 0.0 | 0.1 | 1.8 | 0.0 | 0.0 | 0.0 | 0.1 | 0.1 | 0.1 |
| 10 year groups | |||||||||||
| [2007,2017) | 0.3 | 0.4 | 0.0 | 0.0 | 2.1 | 0.0 | 0.0 | 0.0 | 0.0 | 0.1 | 0.2 |
| [1997,2007) | 0.2 | 0.1 | 0.0 | 0.2 | 1.5 | 0.0 | 0.0 | 0.1 | 0.2 | 0.1 | 0.1 |
| [1987,1997) | 0.0 | 0.2 | 0.1 | 0.0 | 2.6 | 0.0 | 0.0 | 0.2 | 0.2 | 0.2 | 0.0 |
| 5 year groups | |||||||||||
| [2012,2017) | 0.4 | 0.0 | 0.0 | 0.0 | 0.4 | 0.0 | 0.0 | 0.0 | 0.0 | 0.0 | 0.0 |
| [2007,2012) | 0.2 | 0.8 | 0.0 | 0.0 | 3.8 | 0.0 | 0.0 | 0.0 | 0.0 | 0.2 | 0.4 |
| [2002,2007) | 0.4 | 0.2 | 0.0 | 0.0 | 1.8 | 0.0 | 0.0 | 0.2 | 0.2 | 0.2 | 0.0 |
| [1997,2002) | 0.0 | 0.0 | 0.0 | 0.4 | 1.2 | 0.0 | 0.0 | 0.0 | 0.2 | 0.0 | 0.2 |
| [1992,1997) | 0.0 | 0.0 | 0.2 | 0.0 | 2.4 | 0.0 | 0.0 | 0.0 | 0.0 | 0.2 | 0.0 |
| [1987,1992) | 0.0 | 0.4 | 0.0 | 0.0 | 2.8 | 0.0 | 0.0 | 0.4 | 0.4 | 0.2 | 0.0 |
| Year | |||||||||||
| 2017 | 0.0 | 1.0 | 0.0 | 0.0 | 1.0 | 0.0 | 0.0 | 0.0 | 0.0 | 0.0 | 0.0 |
| 2016 | 0.0 | 0.0 | 0.0 | 0.0 | 0.0 | 0.0 | 0.0 | 0.0 | 0.0 | 0.0 | 0.0 |
| 2015 | 0.0 | 0.0 | 0.0 | 0.0 | 0.0 | 0.0 | 0.0 | 0.0 | 0.0 | 0.0 | 0.0 |
| 2014 | 0.0 | 0.0 | 0.0 | 0.0 | 1.0 | 0.0 | 0.0 | 0.0 | 0.0 | 0.0 | 0.0 |
| 2013 | 0.0 | 0.0 | 0.0 | 0.0 | 0.0 | 0.0 | 0.0 | 0.0 | 0.0 | 0.0 | 0.0 |
| 2012 | 2.0 | 0.0 | 0.0 | 0.0 | 1.0 | 0.0 | 0.0 | 0.0 | 0.0 | 0.0 | 0.0 |
| 2011 | 1.0 | 0.0 | 0.0 | 0.0 | 0.0 | 0.0 | 0.0 | 0.0 | 0.0 | 0.0 | 0.0 |
| 2010 | 0.0 | 1.0 | 0.0 | 0.0 | 4.0 | 0.0 | 0.0 | 0.0 | 0.0 | 0.0 | 2.0 |
| 2009 | 0.0 | 1.0 | 0.0 | 0.0 | 5.0 | 0.0 | 0.0 | 0.0 | 0.0 | 0.0 | 0.0 |
| 2008 | 0.0 | 1.0 | 0.0 | 0.0 | 3.0 | 0.0 | 0.0 | 0.0 | 0.0 | 0.0 | 0.0 |
| 2007 | 0.0 | 1.0 | 0.0 | 0.0 | 7.0 | 0.0 | 0.0 | 0.0 | 0.0 | 1.0 | 0.0 |
| 2006 | 0.0 | 0.0 | 0.0 | 0.0 | 2.0 | 0.0 | 0.0 | 0.0 | 1.0 | 0.0 | 0.0 |
| 2005 | 0.0 | 0.0 | 0.0 | 0.0 | 4.0 | 0.0 | 0.0 | 1.0 | 0.0 | 0.0 | 0.0 |
| 2004 | 1.0 | 1.0 | 0.0 | 0.0 | 1.0 | 0.0 | 0.0 | 0.0 | 0.0 | 0.0 | 0.0 |
| 2003 | 0.0 | 0.0 | 0.0 | 0.0 | 1.0 | 0.0 | 0.0 | 0.0 | 0.0 | 1.0 | 0.0 |
| 2002 | 1.0 | 0.0 | 0.0 | 0.0 | 1.0 | 0.0 | 0.0 | 0.0 | 0.0 | 0.0 | 0.0 |
| 2001 | 0.0 | 0.0 | 0.0 | 0.0 | 0.0 | 0.0 | 0.0 | 0.0 | 1.0 | 0.0 | 1.0 |
| 2000 | 0.0 | 0.0 | 0.0 | 1.0 | 2.0 | 0.0 | 0.0 | 0.0 | 0.0 | 0.0 | 0.0 |
| 1999 | 0.0 | 0.0 | 0.0 | 1.0 | 1.0 | 0.0 | 0.0 | 0.0 | 0.0 | 0.0 | 0.0 |
| 1998 | 0.0 | 0.0 | 0.0 | 0.0 | 1.0 | 0.0 | 0.0 | 0.0 | 0.0 | 0.0 | 0.0 |
| 1997 | 0.0 | 0.0 | 0.0 | 0.0 | 2.0 | 0.0 | 0.0 | 0.0 | 0.0 | 0.0 | 0.0 |
| 1996 | 0.0 | 0.0 | 1.0 | 0.0 | 3.0 | 0.0 | 0.0 | 0.0 | 0.0 | 0.0 | 0.0 |
| 1995 | 0.0 | 0.0 | 0.0 | 0.0 | 3.0 | 0.0 | 0.0 | 0.0 | 0.0 | 0.0 | 0.0 |
| 1994 | 0.0 | 0.0 | 0.0 | 0.0 | 3.0 | 0.0 | 0.0 | 0.0 | 0.0 | 0.0 | 0.0 |
| 1993 | 0.0 | 0.0 | 0.0 | 0.0 | 0.0 | 0.0 | 0.0 | 0.0 | 0.0 | 0.0 | 0.0 |
| 1992 | 0.0 | 0.0 | 0.0 | 0.0 | 3.0 | 0.0 | 0.0 | 0.0 | 0.0 | 1.0 | 0.0 |
| 1991 | 0.0 | 0.0 | 0.0 | 0.0 | 0.0 | 0.0 | 0.0 | 1.0 | 0.0 | 0.0 | 0.0 |
| 1990 | 0.0 | 0.0 | 0.0 | 0.0 | 3.0 | 0.0 | 0.0 | 0.0 | 0.0 | 1.0 | 0.0 |
| 1989 | 0.0 | 2.0 | 0.0 | 0.0 | 6.0 | 0.0 | 0.0 | 1.0 | 2.0 | 0.0 | 0.0 |
| 1988 | 0.0 | 0.0 | 0.0 | 0.0 | 2.0 | 0.0 | 0.0 | 0.0 | 0.0 | 0.0 | 0.0 |
| 1987 | 0.0 | 0.0 | 0.0 | 0.0 | 3.0 | 0.0 | 0.0 | 0.0 | 0.0 | 0.0 | 0.0 |
| 1986 | 0.0 | 0.0 | 0.0 | 0.0 | 0.0 | 0.0 | 0.0 | 0.0 | 0.0 | 0.0 | 0.0 |
| 1985 | 0.0 | 0.0 | 0.0 | 0.0 | 0.0 | 0.0 | 0.0 | 0.0 | 0.0 | 0.0 | 0.0 |
| 1984 | 0.0 | 0.0 | 0.0 | 0.0 | 0.0 | 0.0 | 0.0 | 0.0 | 0.0 | 0.0 | 0.0 |
| 1983 | 0.0 | 0.0 | 0.0 | 0.0 | 0.0 | 0.0 | 0.0 | 0.0 | 0.0 | 0.0 | 0.0 |
| 1982 | 0.0 | 0.0 | 0.0 | 0.0 | 0.0 | 0.0 | 0.0 | 0.0 | 0.0 | 0.0 | 0.0 |
Distribution map
Distribution - 2017
This map shows the observed distribution of the Hooded Robin for 2017.
The red circles are the grid cells where Hooded Robin have been reported.
The transparency of the red circles indicate how many surveys sheets were submitted for that grid cell; the darker the red the more reliable the data. Of the 315 grid cells with reports, 83 had only one sheet; an example is grid number A11.
The size of the circle represents the reporting rate. The maximum reporting rate for Hooded Robin was 47.8% (eg grid number F14) and the minimum was 0.2% (eg grid number K14). 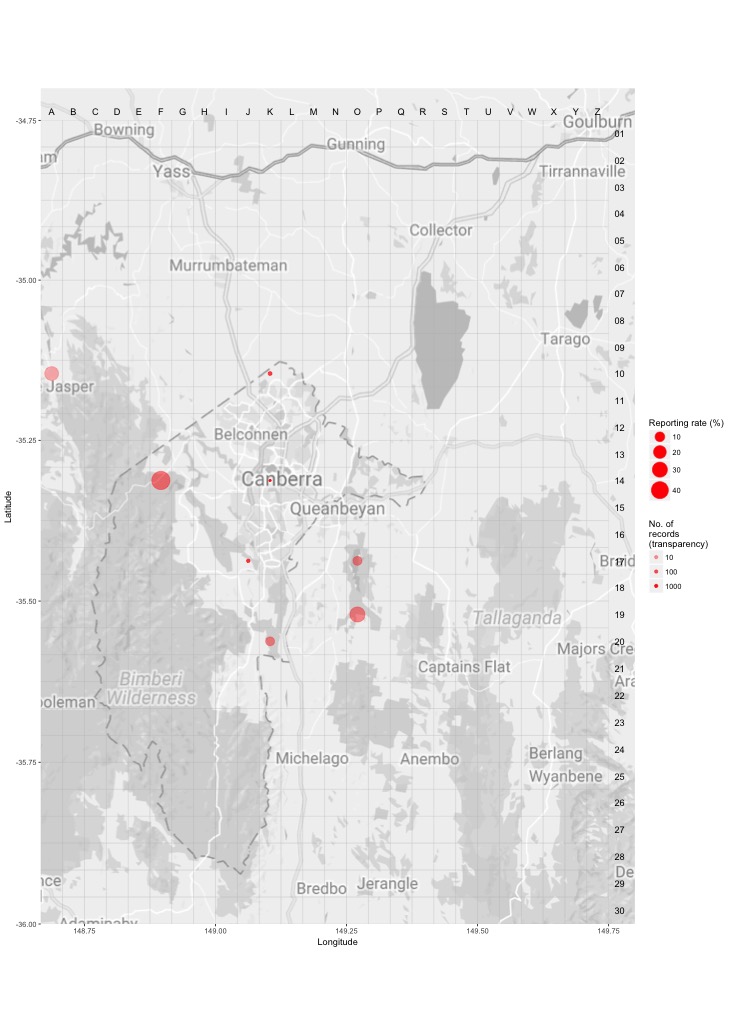
Distribution - all years
This map shows the observed distribution of the Hooded Robin for all years.
The red circles are the grid cells where Hooded Robin have been reported.
The transparency of the red circles indicate how many surveys sheets were submitted for that grid cell; the darker the red the more reliable the data. Of the 703 grid cells with reports, 55 had only one sheet; an example is grid number A12.
The size of the circle represents the reporting rate. The maximum reporting rate for Hooded Robin was 66.7% (eg grid number R24) and the minimum was 0.0% (eg grid number J12). 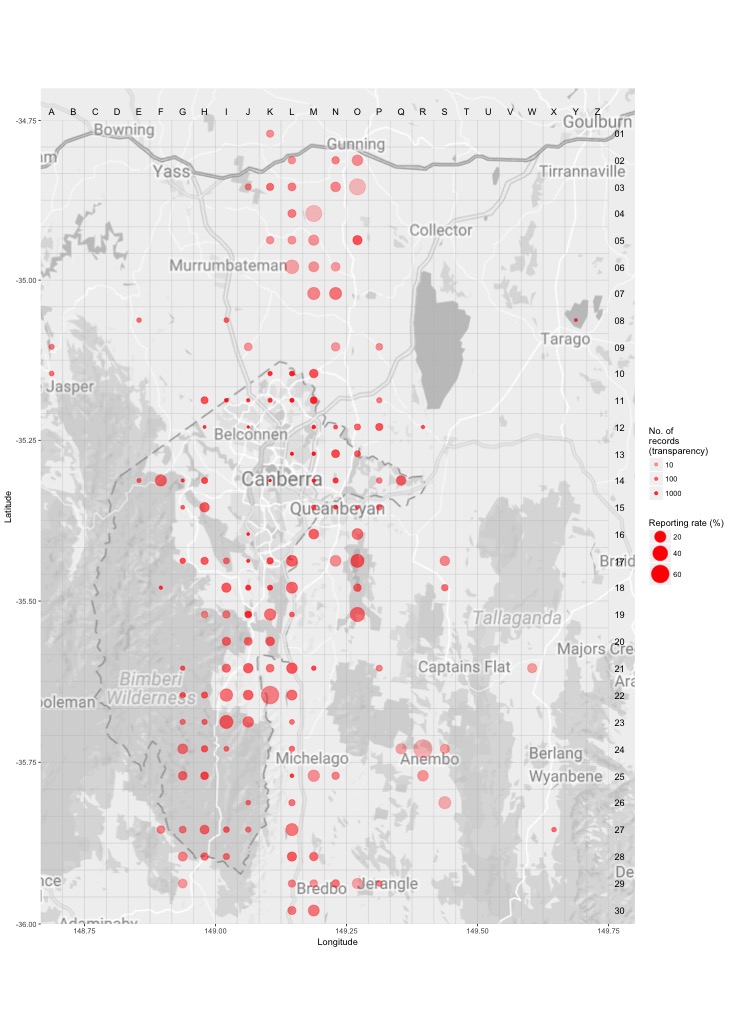
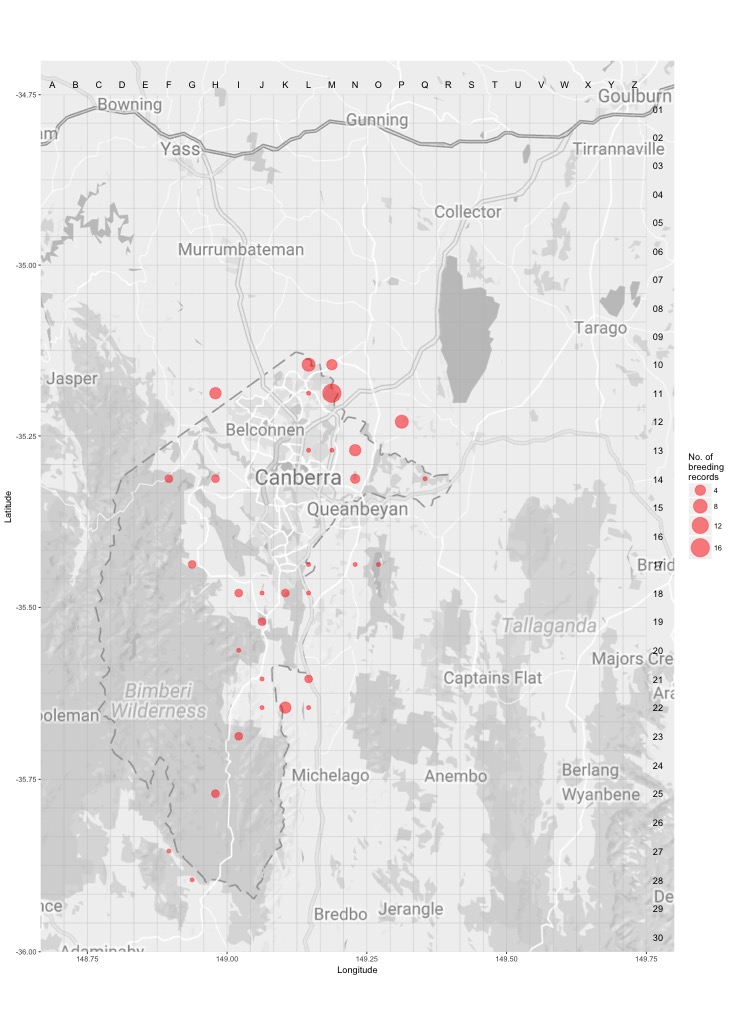
Breeding map
Breeding - 2017
This map shows the breeding distribution of the Hooded Robin for 2017.
The red circles are the grid cells where breeding activity for Hooded Robin have been reported.
The size of the circle represents the number of reports. 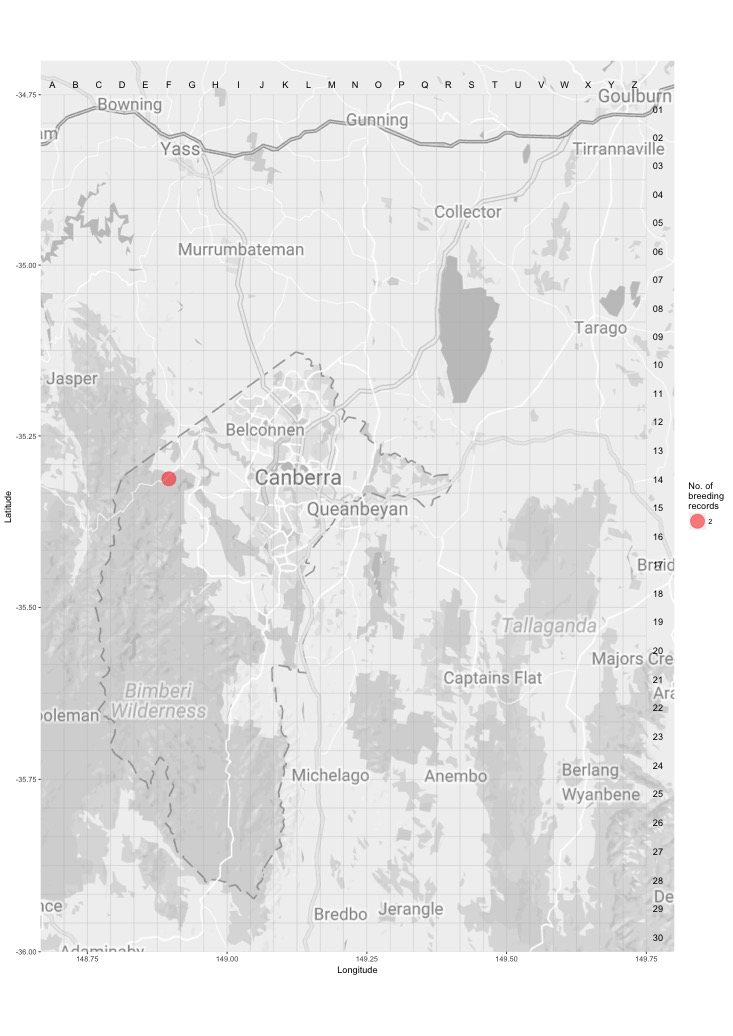
Breeding - all years
This map shows the breeding distribution of the Hooded Robin for all years.
The red circles are the grid cells where breeding activity for Hooded Robin have been reported.
The size of the circle represents the number of reports.